Brief
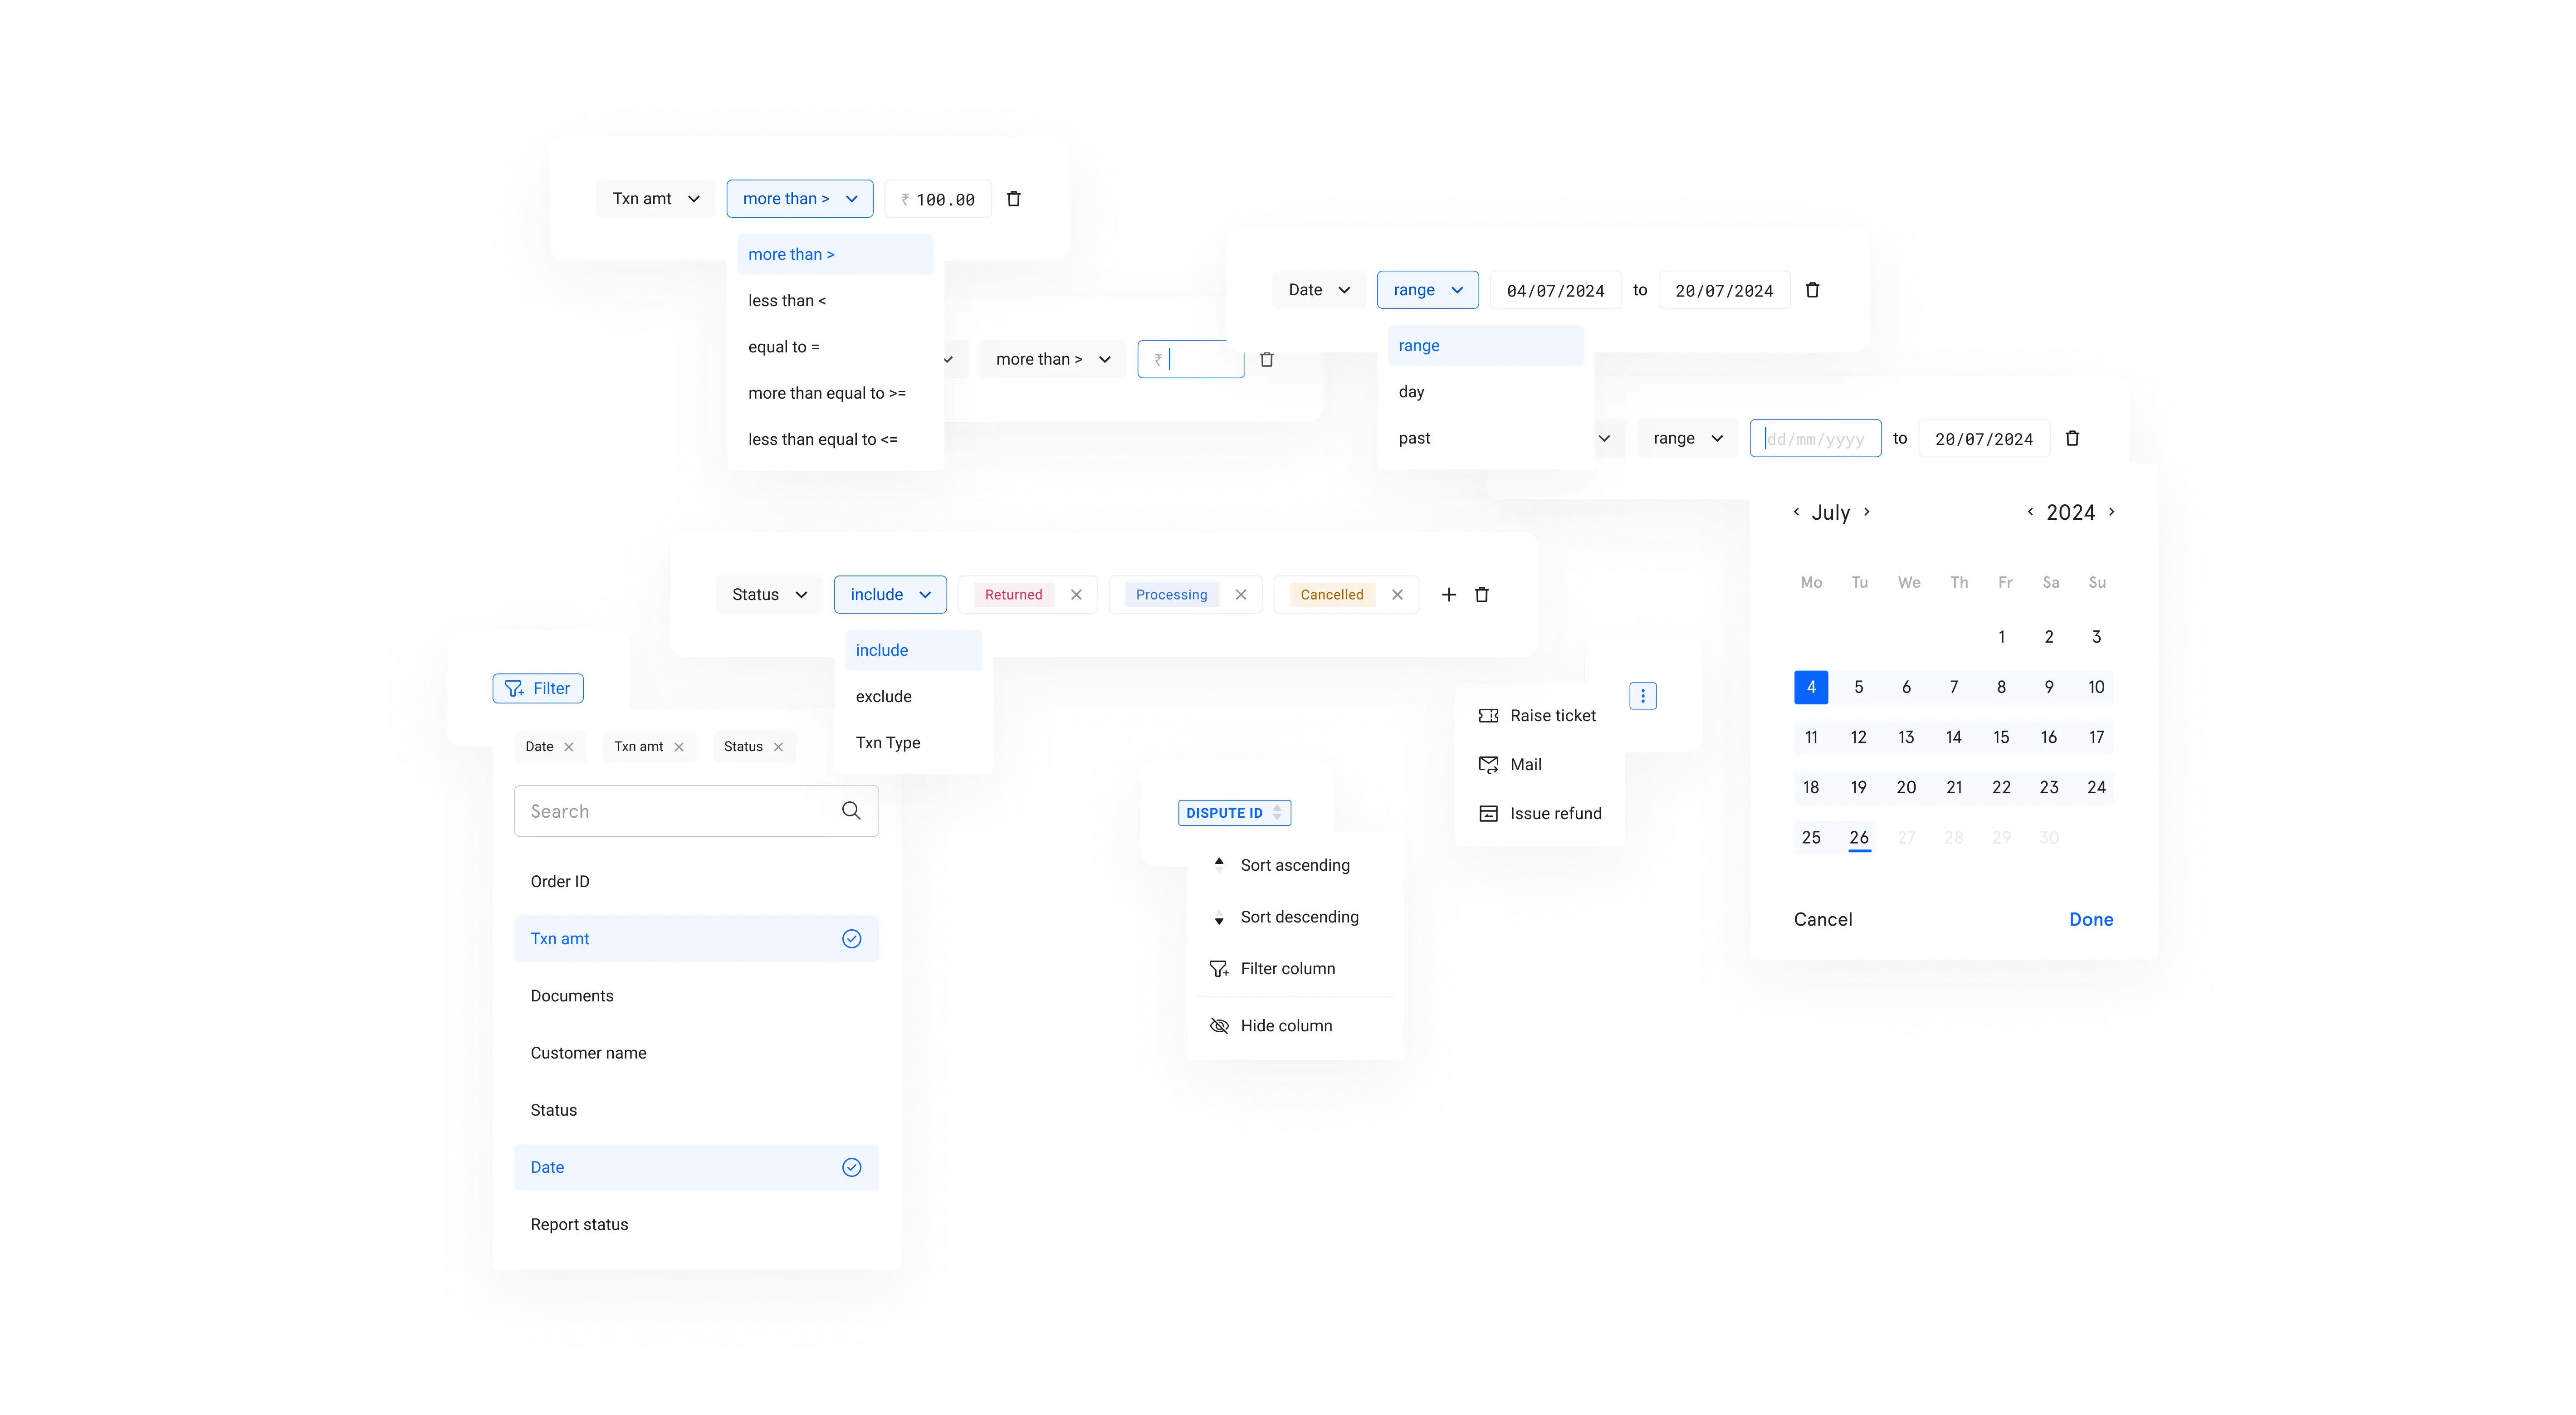
In this project, I leveraged my experience working with a B2B SaaS startup to redesign a data table that is easy to use and understand. The goal was to create a data table that simplifies complex data interactions and improves efficiency of managing large datasets.
Problem
The existing data table was cluttered and difficult to navigate, leading to user frustration and inefficiencies in data management. Users struggled to find relevant information quickly, and taking action on the data was time consuming.
Research
To ensure the redesigned data table met the needs of its users, I conducted interviews with the team members who interact with the table daily. I gathered insights into their pain points, workflows, and specific challenges they faced with the existing design. This direct feedback was invaluable in understanding user frustrations, such as difficulties in finding relevant data, navigating the table, and performing actions efficiently.
Research details:
User demographic
Pain points
100%
thought the data table could be better
75%
did not like the data filtering experience
62%
wanted an option to choose which columns they saw first
87%
taking action on selected data took too long
User testing wireframes
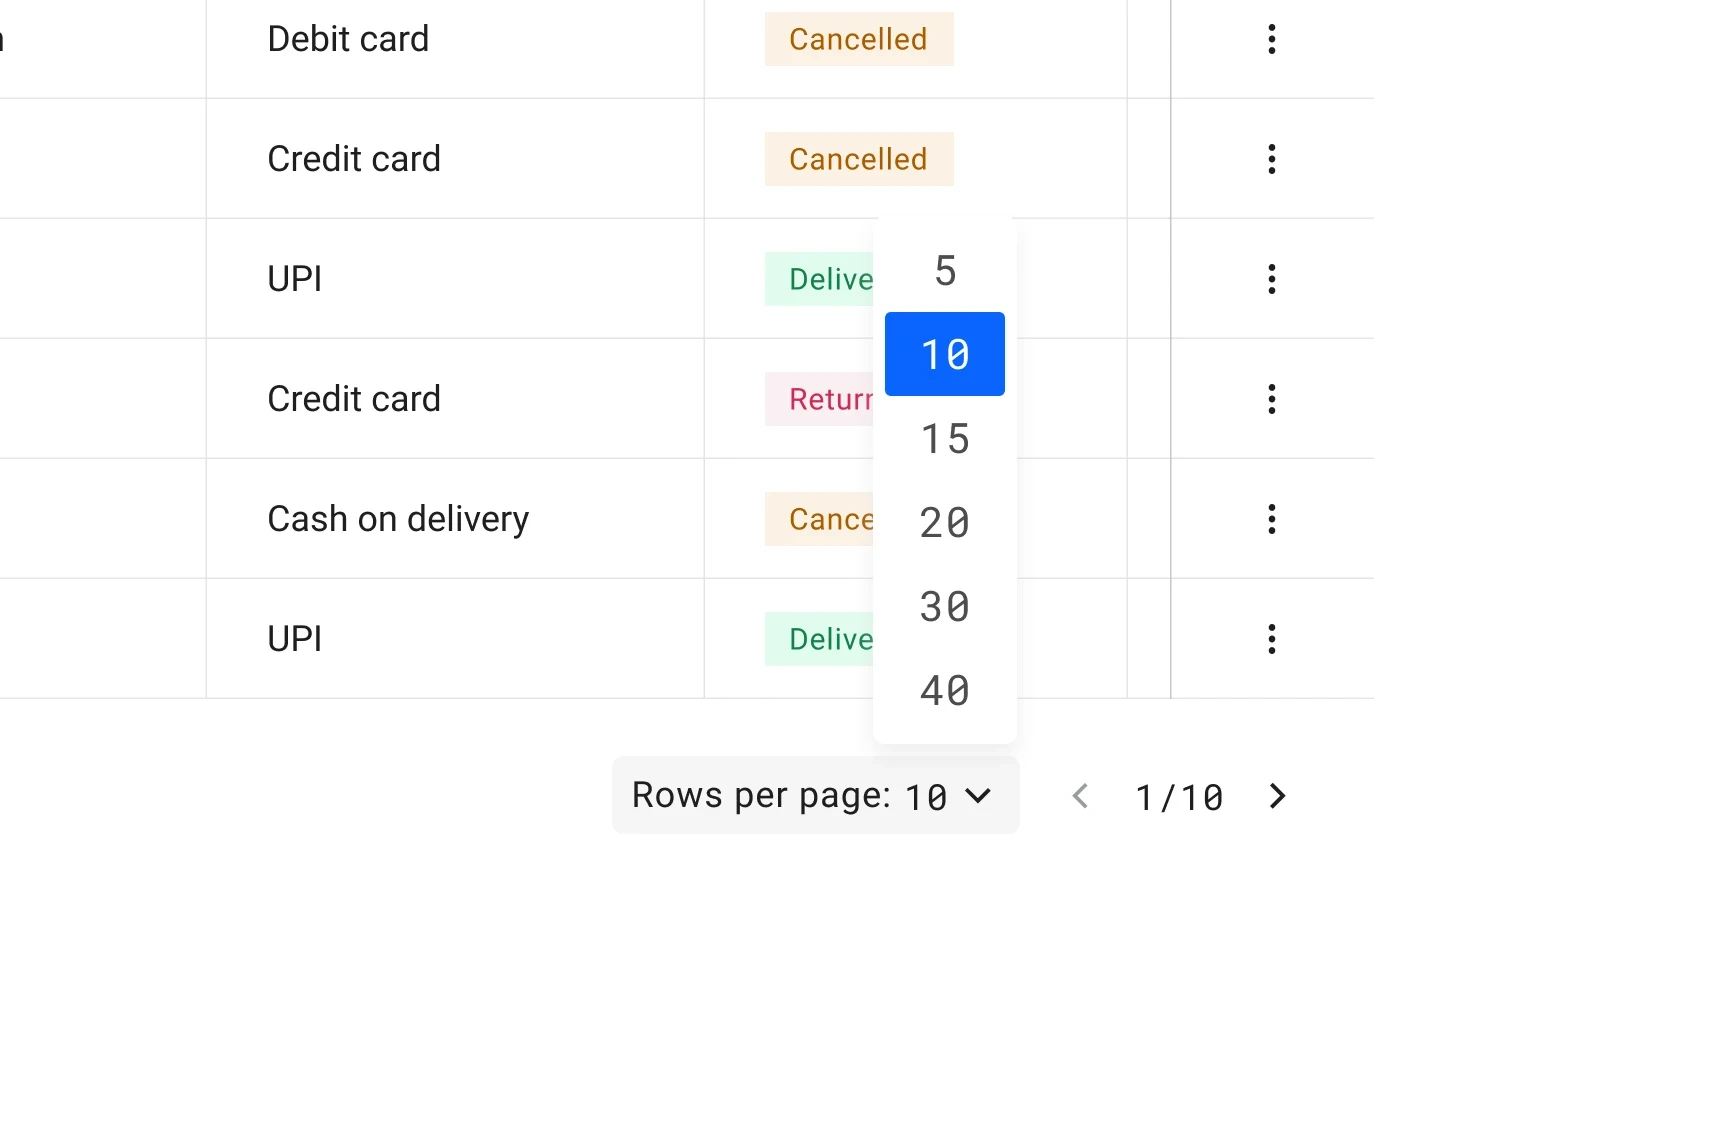
After testing the initial wireframe prototype, while most pain points were resolved but the filtering process was still not as easy as we wanted it to be. They also needed to see more data on the viewport at a time. Once these insights were worked upon I started creating the final high fidelity mockups


More projects


